Data Science & Machine Learning - Part 1
What seems magic at first can prove easy later on. Just give it time. March of 2022, that’s when the Python instructor presented me with the Python packages NumPy, pandas and matplotlib. You may call it the holy trinity of Data Science (DS) and Data Analysis (DA). Add to that Anaconda and Jupyter Notebook and you’ve got yourself the industry standard for DS and Machine Learning (ML). Optionally you could replace the last 2 tools I’ve mentioned with Kaggle which comes with the tagline “the world’s largest data science community with powerful tools and resources to help you achieve your data science goals”. Rob Mulla has a very well documented YouTube channel on DS and he uses mostly Kaggle.
I’m quickly approaching an important milestone, my first year of learning how to code. One last objective remains on my to-do-list and that is to get a taste of DS and ML. It’s the latest trend, especially after OpenAI’s ChatGPT left the world in a fluster just a few months ago. An Artificial Intelligence (AI) that can answer all of your questions, that can also help you code and even give you lessons on ethics and morality. My weapon of choice for the task at hand is the Complete Machine Learning and Data Science: From Zero to Mastery course by Andrei Neagoie and Daniel Bourke. It has a 4.6 rating on Udemy and an impressive number of students that counts no less than 88k.
I’m halfway in this class and I gotta say that it’s indeed getting alot easier to undestand where this is going and why DS and ML are so powerful. That being said, the magic I mentioned earlier is not lost. In fact, I feel more empowered, or better yet I feel imbued with Python’s power. Last week I even used what I’ve learned to perform some Data Analysis and plotting at work for an issue that I was investigating. The fact that my new found skills were useful gave me a sense of pride and purpose, it encoureaged me to continue learning. Mark Twain, you’d be proud of my education!
Just yesterday, before writting this down, I took a break from the Udemy course and wanted to chill with the stuff that Rob Mulla presented in his video LIVE CODING: Stocks & Sentiment Analysis using the yfianance Python package. Unfortunately it seems that this package is no longer usable, at least not as he was using it 4 months ago. After troubleshooting for half an hour on GitHub and stackoverflow I decided to let it go and find my own way. Googled for alternative packages and then googled again, but this time for stock market APIs. Found a handy one at polygon.io. It offers up to 5 free API calls per minute which is plenty for learning purposes. Here’s a stock price chart I’ve produced after reading the documentation and playing with their API and the holy trinity of DS for a couple of hours:
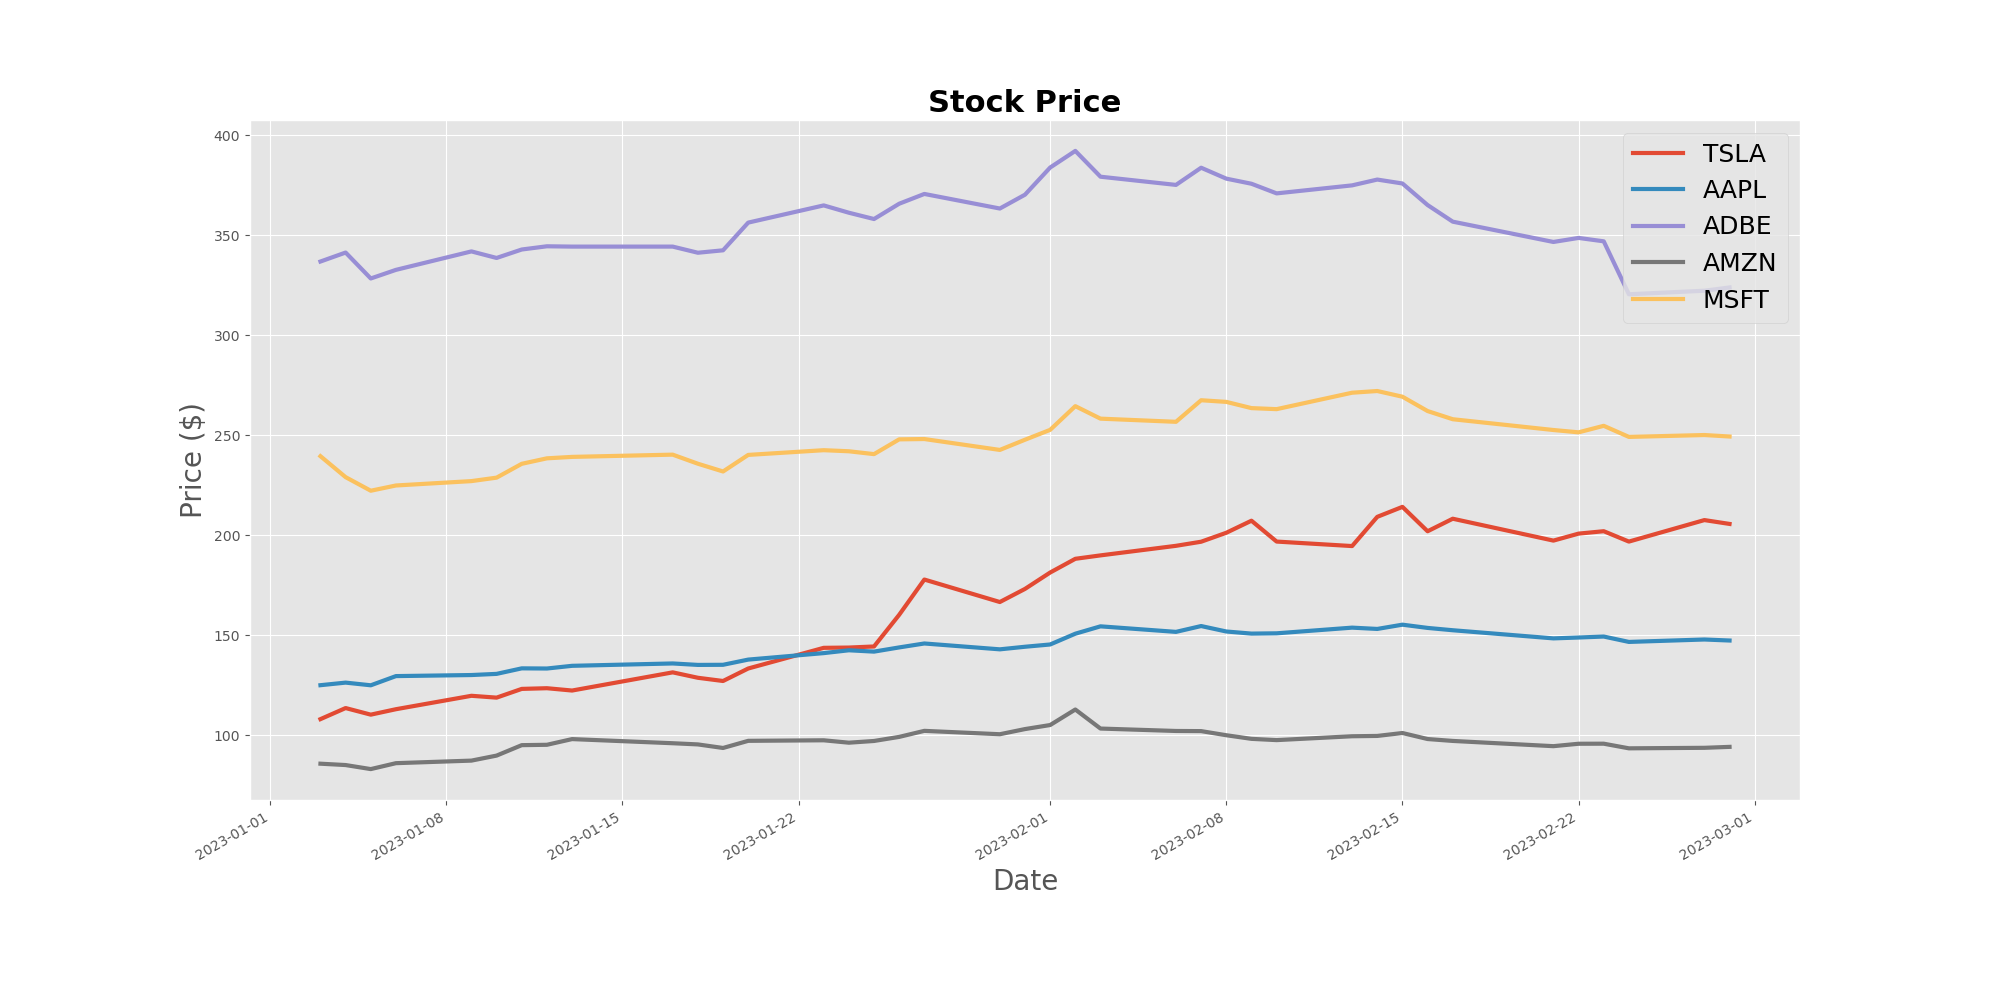
… and here’s the code I wrote for the API calls:
1
2
3
4
5
6
7
8
9
10
11
12
13
14
15
16
17
18
19
20
21
22
23
24
25
26
27
28
29
30
31
32
33
34
35

from polygon import RESTClient
from config import API_KEY

import pandas as pd
import matplotlib.pyplot as plt
import time


def get_ticker_info(ticker, timespan="day", from_="2023-01-01", to="2023-02-28"):
    '''
    Requires a stock's ticker sign in order to obtain its info as an aggregate of
    lists. Converts the list aggregates into a Pandas DataFrame object.
    Creates a new 'date' column (e.g., '2023-01-03') from the 'timestamp'
    (e.g., '1677560400000').
    '''

    # Instantiate the polygon.io RESTful object as client
    client = RESTClient(api_key=API_KEY)

    # List aggregate bars (info) for the input stock ticker
    info = client.get_aggs(ticker=ticker,
                           multiplier=1,
                           timespan=timespan,
                           from_=from_,
                           to=to,
                          )

    # Convert the list aggregates into a Pandas DataFrame
    df = pd.DataFrame(info)

    # Create the date column from the timestamp column
    day_divider = 86400000 # 24h * 60m * 60s * 1000ms
    df['date'] = (df['timestamp']/day_divider).values.astype(dtype='datetime64[D]')

    return df
Pretty neat, right? Or was it magic?